
Even the best teacher cannot facilitate effective learning unless certain supports are in place – these require the collective actions of all staff, including the school leadership. The School Environment and Leadership survey is a tool to provide feedback on these other school-level factors in your context.
The survey is based on the Model for School Environment and Leadership set out in the School Environment and Leadership: Evidence Review (available here). We’d recommend reading the review to learn more about these school characteristics and how they impact students’ learning.
The survey is designed to capture staff perceptions about these school-level factors. Like the student surveys, the statements are anonymous and feedback will not be generated until five or more responses have been collected.
The survey comprises just under 50 multiple choice questions, plus one free-text question so staff can share any other thoughts or reflections, should they choose to. It should take no more than 10 minutes and we suggest that all staff who are involved in teaching and learning should be included – this may be broader than just teachers.
You can watch a short introductory video about the survey here.
Setting up a survey
The survey is available in all Coordinator and Assistant Coordinator accounts and is accessible by clicking on the “School management” menu item. From here, click on the orange "Launch survey" button under the School Environment & Leadership survey heading.
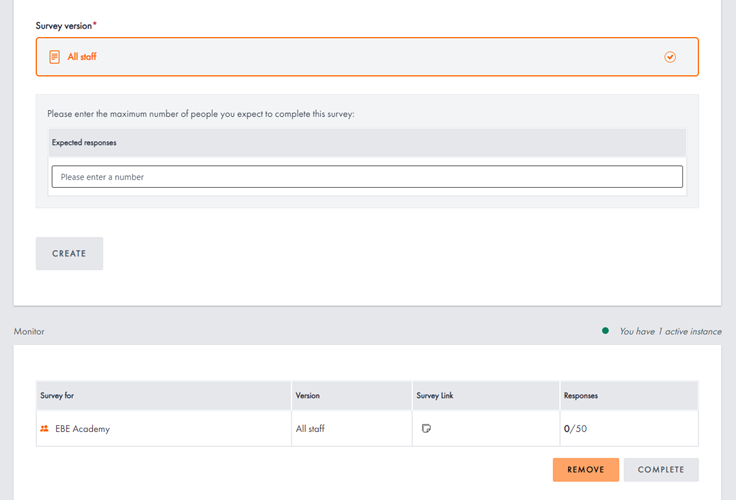
On the page that opens, click on the “All staff” survey version, enter the number of expected responses below, and click “Create”.
The survey will then appear in the “Monitor” section below. Click on the icon below “Survey link” to copy the link to the survey and share this in an email or message with your staff. You will be able to see the number of staff who have completed the survey in the “Responses” column.
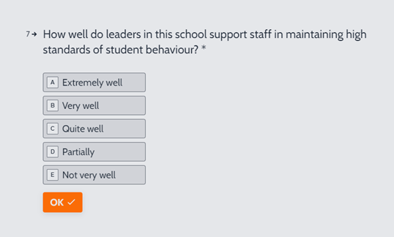
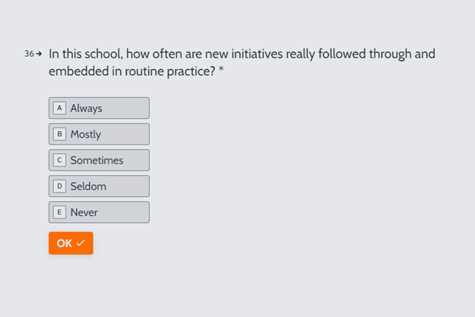
Example questions
Understanding the feedback
The image below shows an example of the feedback generated from the survey. Responses are divided into two categories, which may be thought of as positive / acceptable and negative / unacceptable. Positive responses are always shown with darker colours, at the bottom end of the bar, negative responses have lighter colours, presented at the top end of the bar.
For each question, the number in the white circle is the total percentage of positive / acceptable responses. The higher this number, the better.
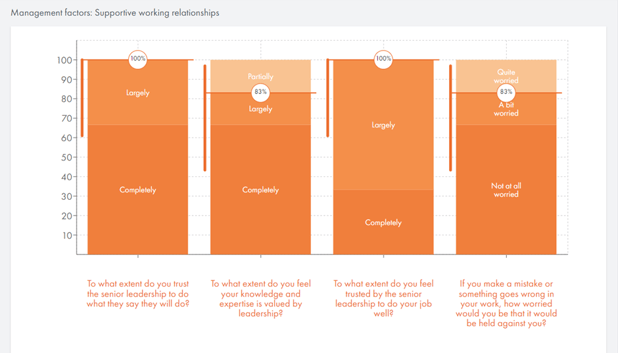
A vertical line, to the left of each bar, indicates a 95% confidence interval for the percentage of positive responses. Given that the surveys come from a sample of staff, we might expect the percentage to vary a bit depending on exactly who responded. The confidence interval shows a likely range of variation in that percentage for a sample of this size that could arise purely as a result of sampling. In particular, with a small number of responses, the confidence interval may be quite big; we should be careful not to treat the percentage as too precise.